

This is the third article in Yes Energy’s summer demand series, which covers new market complexities. In the first article, Alex Bennitt, product manager for Yes Energy, breaks down the macro-level demand trends, load projections, and market uncertainty that are impacting traders, asset developers, and resource planners. The second installment focuses on skyrocketing demand and projections in ERCOT, with themes that resonate for ISOs across the United States. Below, we dive into how hyperscale data centers like OpenAI’s Stargate Abilene campus are actually operating on the grid.
Hyperscale data centers are massive computing facilities operated by major tech companies, such as Amazon Web Services (AWS), Google, and OpenAI. A single location houses thousands of servers that run enterprise cloud computing and storage or power artificial intelligence. Often spanning millions of square feet, hyperscale data centers are power-hungry. Demand can range from hundreds of megawatts to upwards of a gigawatt.
There's a lot of discussion in energy circles around how hyperscale data centers currently operate on the grid, how they will operate, and how they should operate. The problem with much of this discourse has been a lack of actual grid-scale data. The fact is, building hyperscale data centers doesn't guarantee they’ll have a major market impact. Their impact depends on how they operate on an hourly basis and whether they rip through load peaks or are curtailed.
In reality, data centers aren’t impacting the grid as you might expect. ERCOT data shows they’re running well below their reported capacities, and they have no meaningful price response, even during some of the most trying grid conditions.
Nameplate Capacity vs. The Reality
There are two different operational modes typical of hyperscale data centers. First, there are sites like Google's Midlothian, Texas, Sharka Data Center. With almost no load variation, this facility is a prime “steady-eddy” example — plus or minus two megawatts on an hourly basis, and no reductions in facility output, other than two drops in September and November, which could be completely unrelated to market dynamics.
Core Scientific’s Denton, Texas, crypto mine represents the opposite end of the operational spectrum: It’s a truly price-responsive resource that can turn off its demand extremely quickly. Over six days, this crypto mine fully shut down operations on five of the days during potential Four Coincident Peak (4CP) intervals.
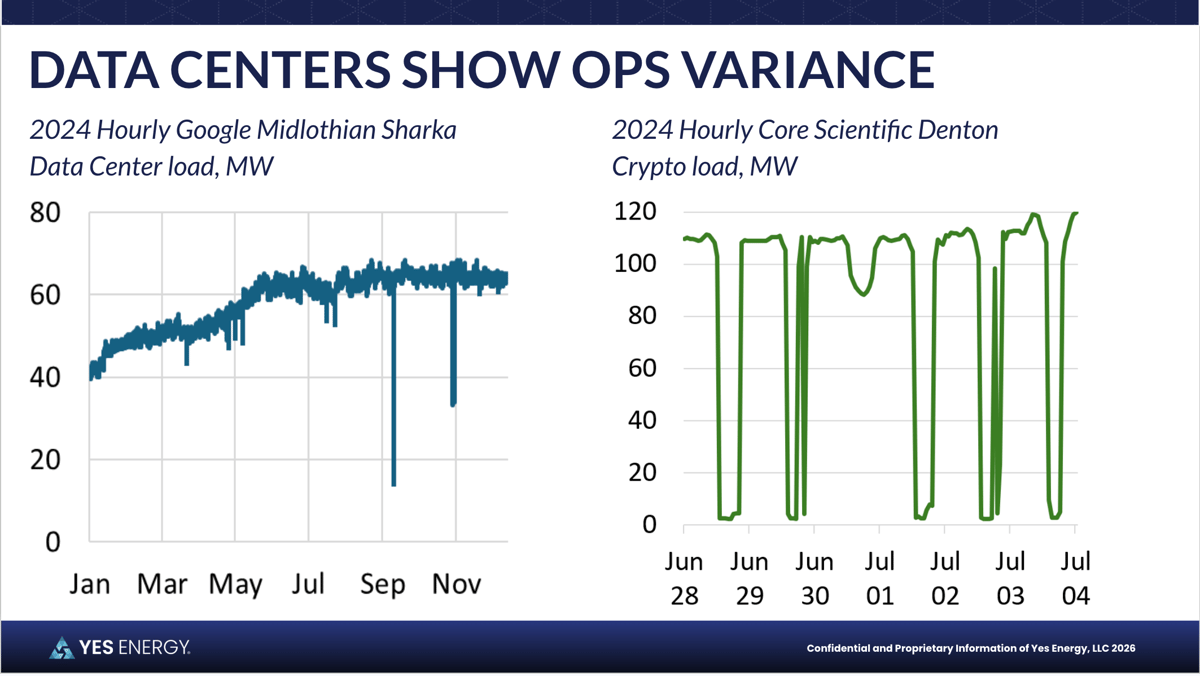 For a little bit of context, the Core Scientific data is from a 4CP interval in ERCOT, so wholesale load wasn't necessarily accounted for correctly. 4CP identifies the highest 15-minute interval of system-wide demand in each of June, July, August, and September, then averages a facility’s load during those four peaks to set the customer’s transmission charges for the following year. If you can curtail during that window, you can lower your costs.
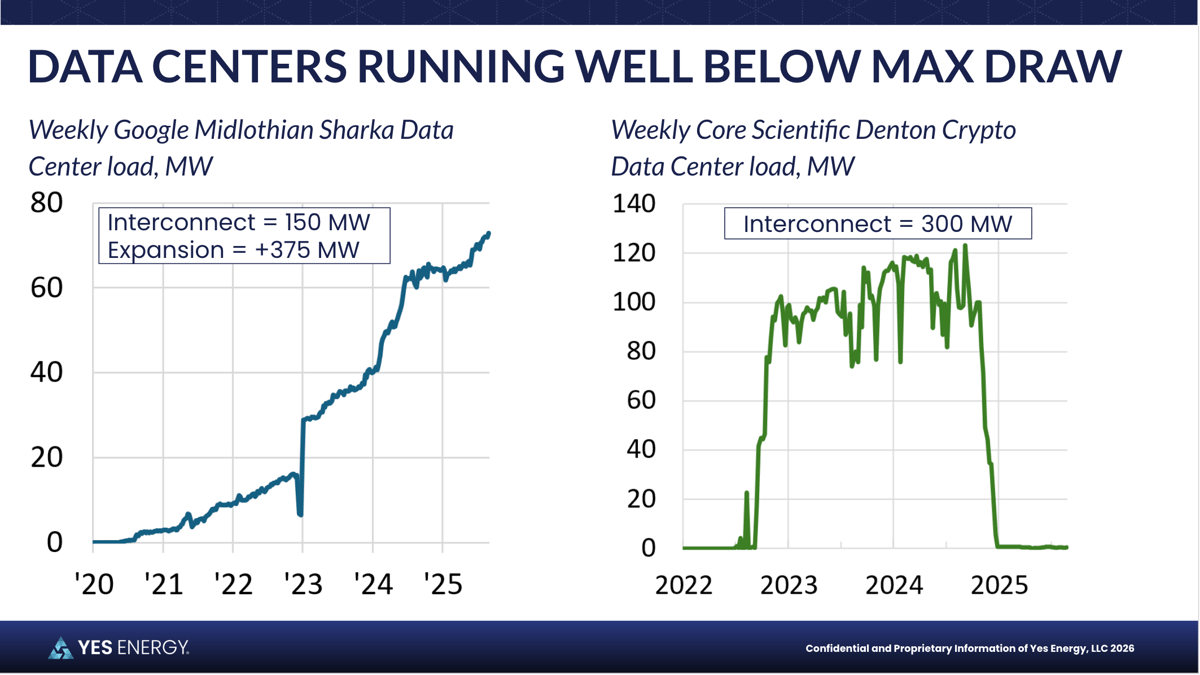
What’s clear is that there is a significant mismatch between the capacities these data centers report and their actual load. Hyperscale data centers aren’t getting close to their reported capacity, likely because developers are leaving operational headroom for future expansion.
For example, Google Midlothian has an interconnect of 150 MW (Google recently announced a 375 MW expansion), but it took five years to reach just half of that. The crypto mine had a 300 MW interconnect, but the facility peaked at 120 MW. It reached 100 MW within weeks, which is pretty standard for crypto mines. Still, the facility never came close to the available interconnect (the load drops to zero in 2025 due to Core Scientific’s bankruptcy).
Operational Data from the Stargate Abilene Campus (ERCOT): A First Look
Stargate Abilene, a 10-building, 1,100-acre campus in ERCOT, is a great example. With OpenAI as its primary tenant, this is the most prominent data center currently connecting to the grid.
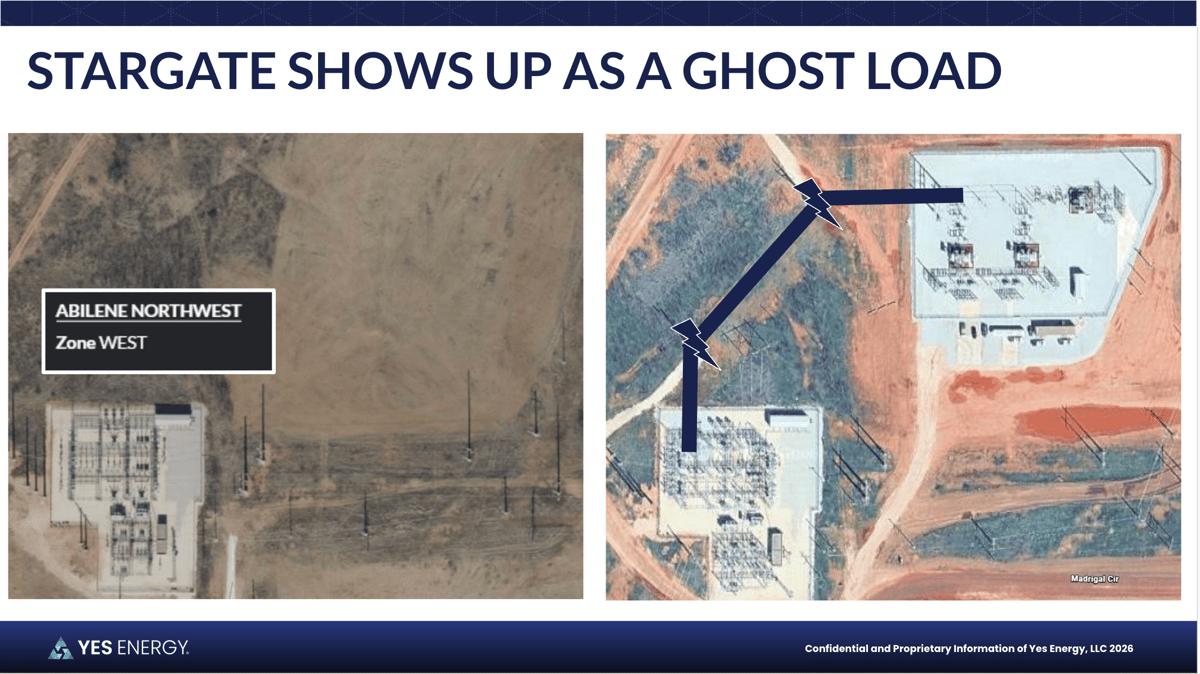
The facility shows up as a ghost load. It’s fed by a double 345 kV corridor that goes from Midland to Graham, Texas. There's also a substation next to the facility called Abilene Mulberry Creek and a 138 kV substation called Abilene Northwest, which sits on Stargate’s property border.
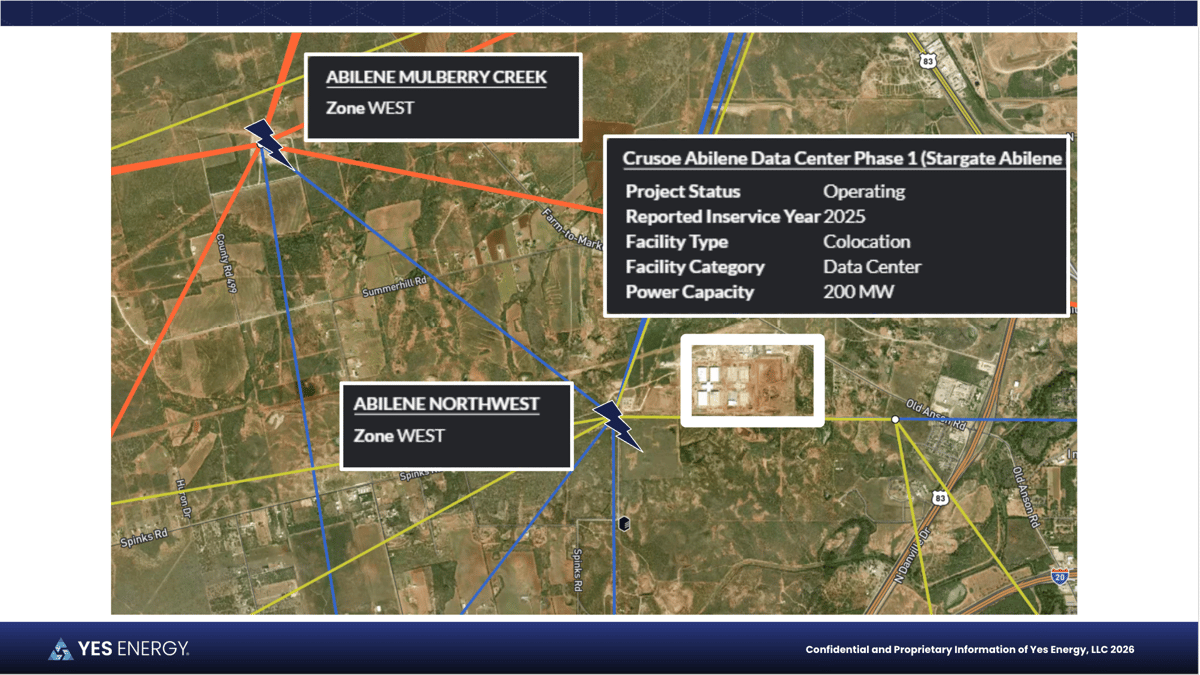 Yes Energy's real-time price map with the transmission overlay for Stargate Abilene.
Stargate’s developers are co-locating gas generation, which is becoming increasingly common, but because it’s behind the meter, it's tough to account for its impact. However, because this facility connects to the electric grid, its load is revealed in ERCOT’s data.
There are about 738 kV of lines connected to the Abilene Northwest substation. Assuming it isn’t serving a major industrial load, the power flow on all lines should equal zero.
A transmission line connects Abilene Northwest to a substation on Stargate’s campus. While that line itself doesn’t appear in SCED data, ERCOT reports flow on a 60-day lag for every line going into Abilene Northwest. By summing all of those lines, you can see Stargate’s ghost load.
Contracted Load vs. Operational Load — Why the Difference Matters
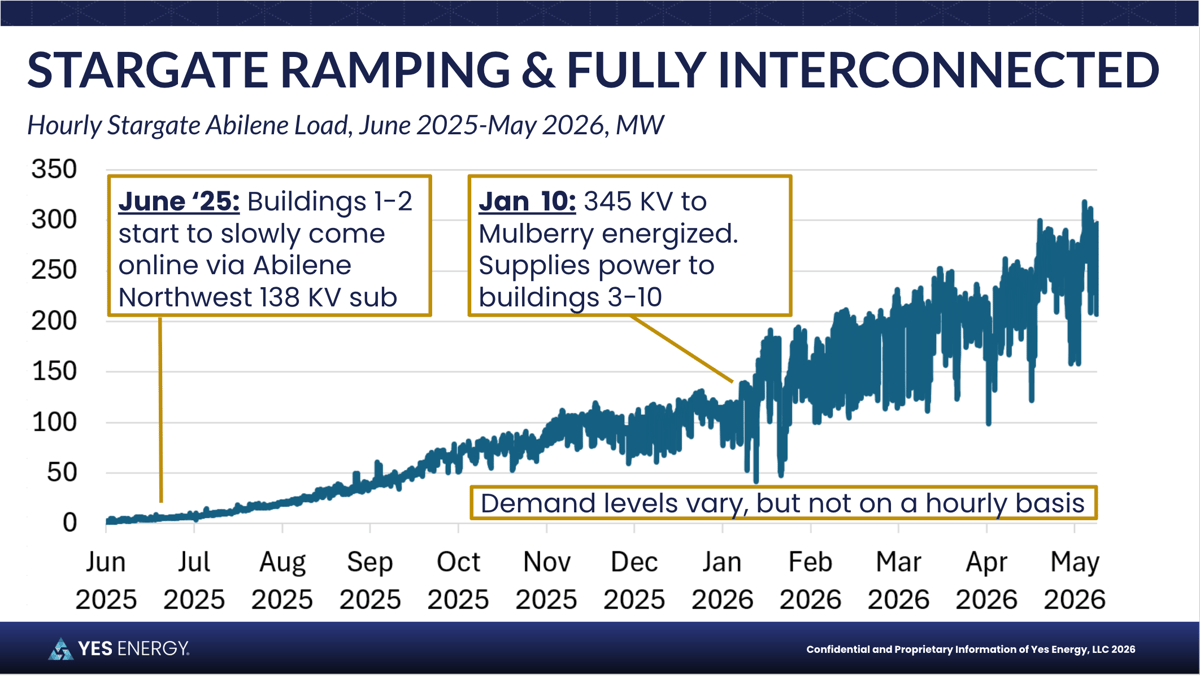
So, what does the data tell us about how this facility is operating? On June 25, 2025, buildings 1 and 2 connected to the Abilene Northwest substation. They came online slowly, and over six months, the facility reached about 75 MW of consumption. On January 10, the new 345-kV line to the Mulberry substation was energized, supplying power to buildings 3 through 10. This also showed up as a ghost load for three months.
In October, November, and December, before the 345 kV line was connected to the grid, buildings one and two reported capacity of 200 MW, but they connected only about 120 MW. That’s just 55% to 60% of the reported capacity, added over six months. It's a little bit quicker than what happened at Google Midlothian, but not as fast as the crypto mine.
After the 345 kV line was energized, the facility’s load essentially doubled over the following six months. As of May 2026, load had climbed to 300 MW. The developers have reported the entire campus will be more than 1 GW, but it’s currently not operating at anywhere near that capacity.
Demand at the facility varies, but there are no large hourly shifts shown in ERCOT’s bulk high-voltage grid data, and we’re not observing a meaningful price response at the facility.
 There wasn’t even a meaningful price shift in January 2026, when a massive winter storm moved across the country. There was a small price spike during the solar ramp down on January 25, and prices approached $1,000 per megawatt-hour. There’s a dip during that interval, but not a major reduction. It didn't move for the first couple of thousand-dollar intervals, and then it moved back up for the last thousand-dollar interval. That dip is likely just a coincidence. On January 28, the price spiked over $1,400 per megawatt-hour, but the facility didn’t flinch — it actually ramped up.
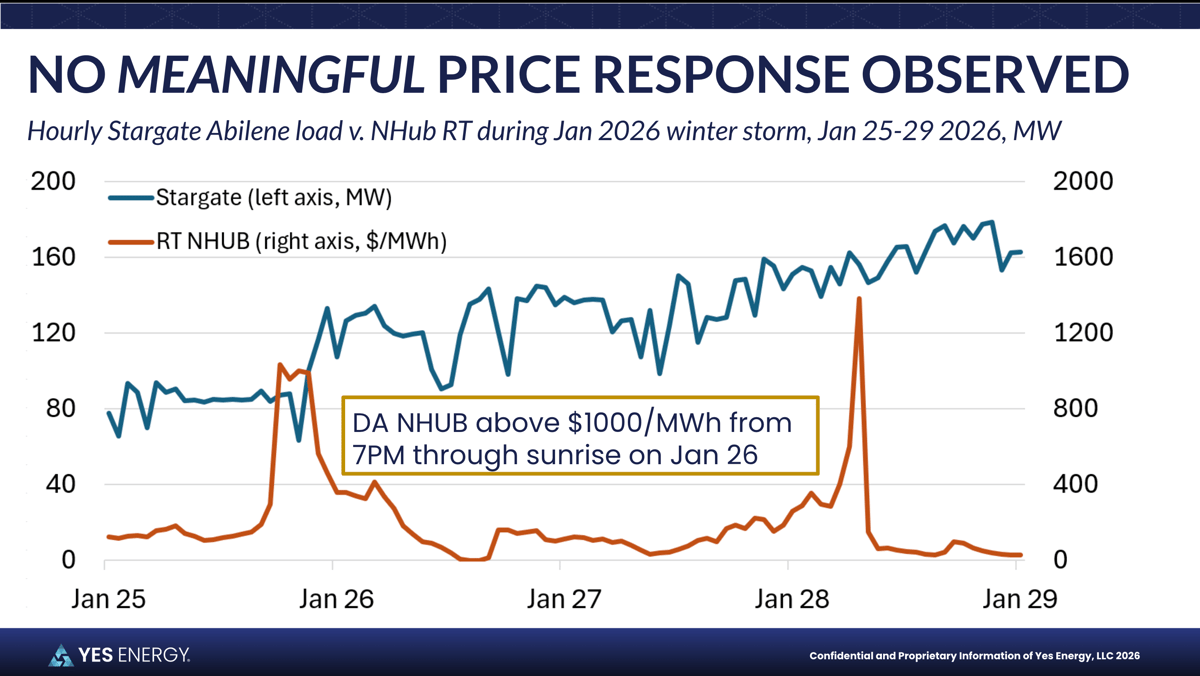 For the day ahead, the North Hub was above $1,000 for nearly a full day, starting at 7 p.m. January 25 through sunrise on January 26, and Stargate ramped up during those intervals as well. Again, there were no indications of a meaningful price response.
What Real Grid-Scale Data Reveals That Market Discourse Doesn't
While ERCOT data is useful in this type of analysis, it is published on a 60-day delay, so it’s not very timely if you want to know how the Stargate facility operated last month or yesterday. This is where Live Power changes the game.
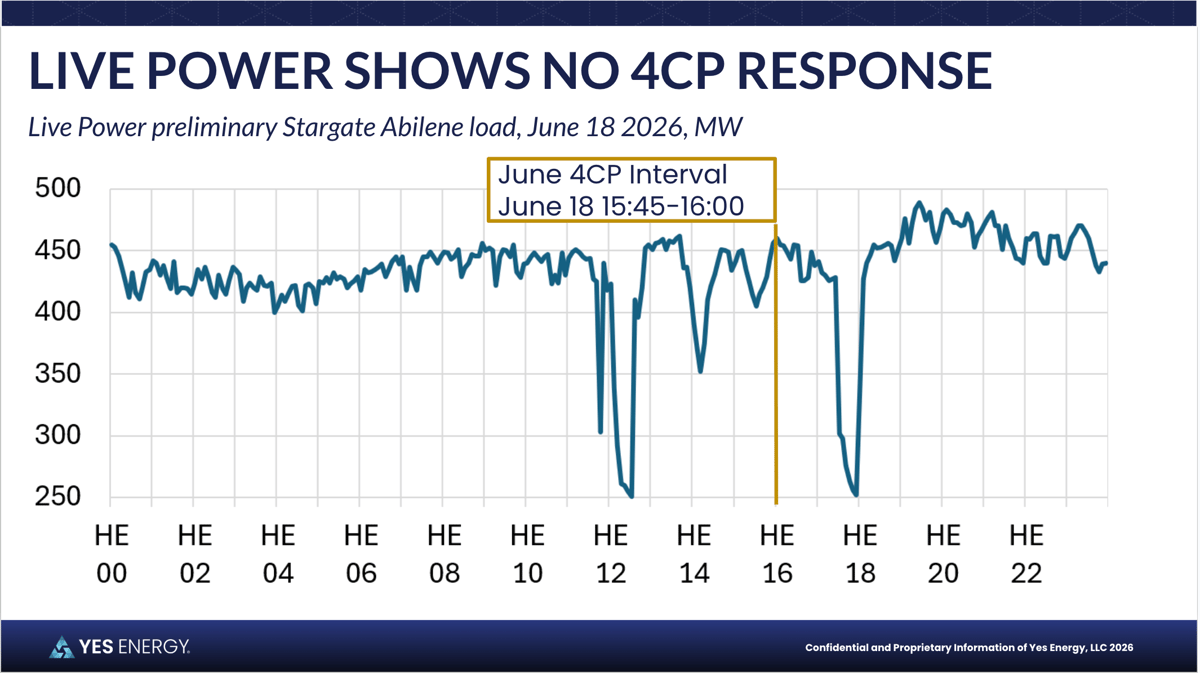
Live Power, Yes Energy’s transmission, generation, and load center monitoring product, uses physical sensors in the field to take magnetic field measurements. It gives you real-time data on generation facilities, transmission line flows, and load center flows, filling in the gap created by ISO data lags. For this analysis, Live Power provided data for June and July, giving us Stargate operational data 60 days before ERCOT publication.
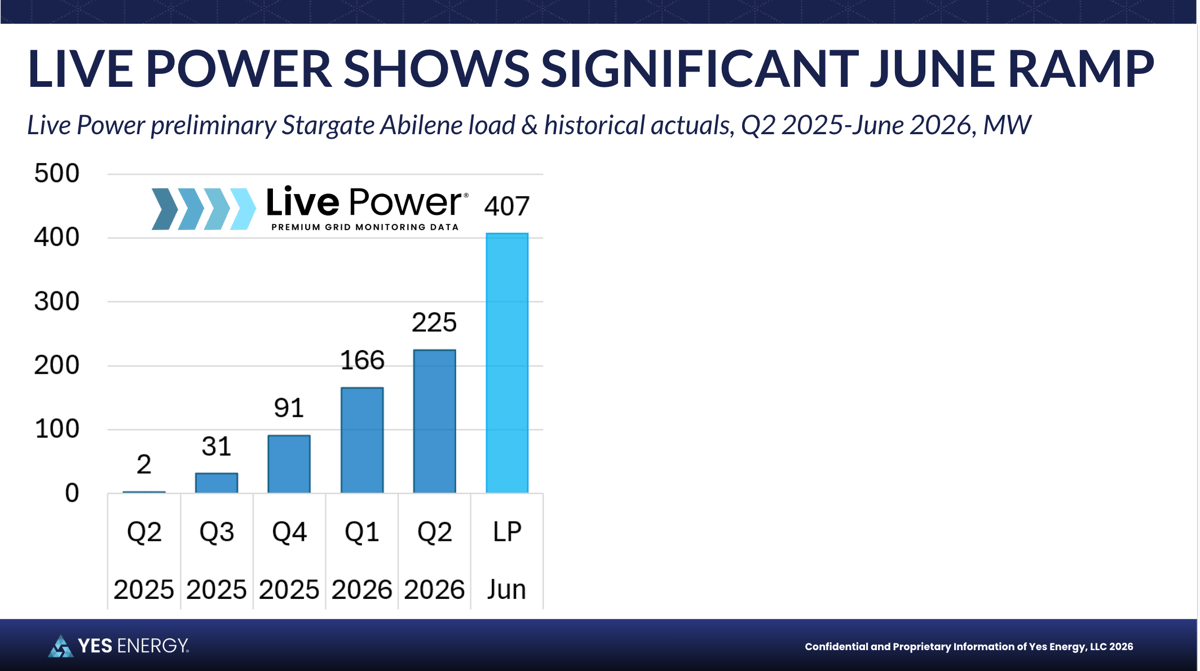
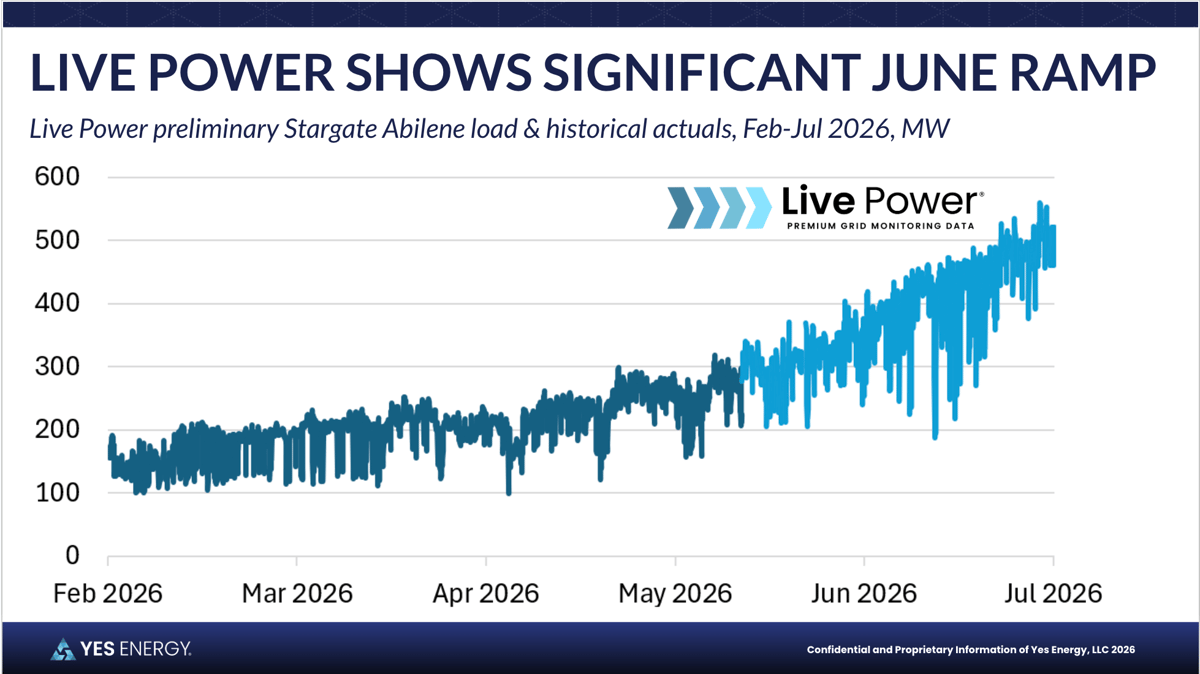 It also shows how the facility ramped up at an unprecedented level in June (to about 407 MW) which is significant, given that they brought on just 225 MW over the previous five quarters. Whether that growth rate persists or caps out at 500 MW will greatly impact market dynamics, and the only way to know what’s happening in real-time is with Live Power data.
 Preliminary data from Live Power also reveals that there is no 4CP response at the facility. The facility actually ramped up during the June 18 interval. There are some visible drops, though the day-ahead, real-time, and net peak loads reveal no discernible patterns around when or why the facility changes output.
Putting the Data to Work
Stargate Abilene is representative of what other hyperscale data centers are doing across the country. There isn’t much price response when these loads come onto the grid, and loads from these facilities are not ramping at the reported levels. If you're building a model, we recommend using 50% or 60% of the reported capacity as the actual load and considering a six-month to one-year time frame for loads to come online.
If you want to learn more about Live Power and how it can help you understand how hyperscale data centers are impacting the markets, watch the full webinar or request a demo.
Next up in our summer demand series: Unraveling the mystery of how crypto mining is impacting the market.
Meet the Author